
For those unfamiliar with OneStream’s reporting capabilities, the two most often used ways to view data in a user-friendly manner are Cube Views and Dashboards. This will be a three-part series that shows how you can create a simple Cube View, Dashboard and how to make them dynamic.
Part 1 – How to Build a Simple Cube View Report
Part 2 – How to Build a Simple Dashboard
Part 3 – How to Make Your Cube View and Dashboard Dynamic with Parameters
In Part 2 we’ll go over how to utilize the previously built Cube View to build a simple dashboard. We’ll assume that you understand the basics of building a Dashboard and how to create and add the individual components.
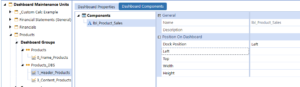
Start by creating the required Maintenance Unit to house the Dashboard and name it Products. From there create the required components, in this example we’re only going to create the Label and Cube View components.
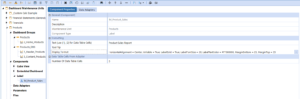
Note: the naming convention used for the components created.
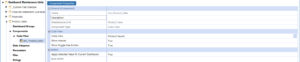
The formatting used for the label is: HorizontalAlignment = Center, IsVisible = True, LabelBold = True, LabelFontSize = 20, LabelTextColor = #FF000000, MarginBottom = 25, MarginTop = 25

Modern Accounting: How to Overcome Financial Close Challenges
Improvements in each of the following period-close core tasks can provide transformative change and are reviewed in this guide include closing the books and external reporting, periodic reconciliations, and managing the period-close process.
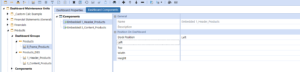
Create the Dashboard Groups. It’s best practice to create 2 groups, one to house and build the individual Dashboards and a master group that combines those Dashboards, and which is shown to end-users.
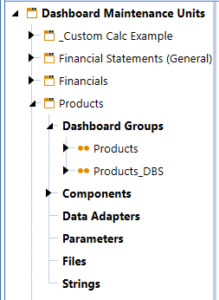
Within the _DBS group, create the individual Dashboards and add their respective components. Within the master (non _DBS Dashboard) create the master (0_Frame) Dashboard which will be shown to end-users. Remember to follow OneStream best practices when it comes to naming Dashboards as shown.
Note: for each type of component/section of your master Dashboard, you will need to create an individual Dashboard in the _DBS group. Currently we have 2, one for the Label and one for the Cube View. They are named 1_Header_Products and 3_Content_Products respectively.
Note the difference of the added components in the individual Dashboards versus the master Dashboard. One calls the components, the other calls the Dashboards themselves.
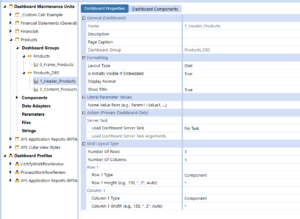
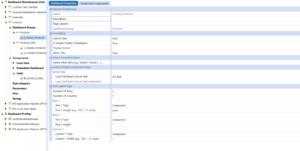
The settings for the 0_Frame_Products Properties should look like the screenshot below.
The completed Dashboard should look like the screenshot below.
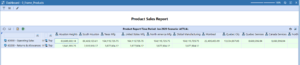
We’ve now built out a very simple Dashboard that used the Cube View we built in the last blog post. We added individual components like Labels and Cube Views, modified the properties and formatting to show in a much friendlier way, allowing our end-users to view a polished report when needed.
In our next blog post, we will modify our existing Cube View and Dashboard and make them more dynamic by introducing parameters