
For those unfamiliar with OneStream’s reporting capabilities, the two most often used ways to view data in a user-friendly manner are Cube Views and Dashboards. This will be a three-part series that shows how you can create a simple Cube View, Dashboard and how to make them dynamic.
Part 1 – How to Build a Simple Cube View Report
Part 2 – How to Build a Simple Dashboard
Part 3 – How to Make Your Cube View and Dashboard Dynamic with Parameters
In Part 1 we’ll go over how to utilize your underlying data to build a simple Cube View to make a user-friendly report. In our example we’ll be using the Golf Stream demo application. We’re assuming that the data is already loaded to the cube, consolidated and readily available to view. We’re also assuming that you know the basics of building a Cube View.
Below is a screenshot of the raw data in excel. Our goal will be to build a Cube View for the Product Income data in this blog and build on it in subsequent posts.
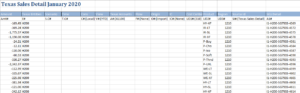
As you’ll see shortly, the cube with the data we’ll be retrieving from only utilizes the UD1 – UD3 dimensions to store the Cost Centers, Products, and Sales Regions data respectively. All other UDs will be set to None as they are not used. We’ll be looking at the income data stored in Account 60999. We’ll use the Row and Column member filters to pull specific data pertaining to product income by entity and product manufactured for our Cube View report.

Modern Accounting: How to Overcome Financial Close Challenges
Improvements in each of the following period-close core tasks can provide transformative change and are reviewed in this guide include closing the books and external reporting, periodic reconciliations, and managing the period-close process.
First, we’ll create a new Cube View Group called Products, and create a new Cube View called Product Sales within the Products group. From here, we’ll edit our POV tab to point to the following information:
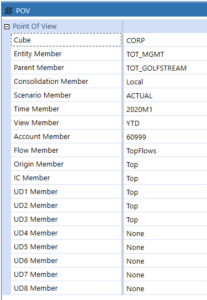
Note: this POV tab will look different on your system outside of the demo application as each Cube is built differently. The Parent Member should autofill based on what you enter for the Entity Member.
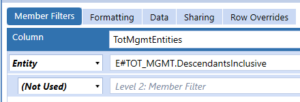
Within Col1, we’ll go ahead and make the following changes to the column name and set the member filter to point to the Entity we want to view. Here we are dynamically pulling each child-member within the TOT_MGMT Entity to view by using .DescendantsInclusive.
Within Row1, we’ll make the following changes to view the account we want. We will be using slightly advanced concepts by using the 2nd member filter option that is made available to us by OneStream to view Data in a slightly more dynamic way. Data will be shown as a collapsible group so that we can view the total, or see the individual components based on what we set in the 2nd member filter.
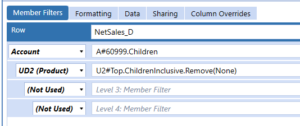
Note: We renamed the Row to NetSales_D – _D is meant to emphasize that this is a row containing Data, while _T would emphasize that this is a row containing the Total (not used in this build). Notice how we’re using the 2nd member filter, pointed to UD2 (Product), to pull income data by product (this will show as a collapsible group in the report).
When you run the Cube View, the report should look like the screenshot below:
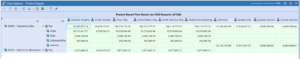
Notice here how we have multiple columns; this is the result of the .DescendantsInclusive we called on E#TOT_MGMT in the column we edited previously. You can also see the result of adding the 2nd member filter and the way it makes our report more dynamic and user-friendly.
With this we’ve completed building out a basic Cube View to view in a user-friendly way utilizing data that’s already loaded. We also covered briefly how to make it slightly more dynamic by using the 2nd member filter option given to us within the Rows.
In the next post we’ll discuss how to build a Dashboard based on this Cube View.