
Salesforce Data can assist your business in making Intelligent Decisions. When you are asked to create a Report, it is usually in the form of a question. Any Salesforce Administrator using the platform must become a Reports and Dashboards guru.
So, grab your coffee and let’s dive deep into reports and dashboards.
What Are You Going to Learn in this Blog?
- Creating and customizing reports
- Creating report folders, bucket fields, and exporting report details
- Sharing model impact on reports
- Creating and modifying dashboards
- Custom report types
Creating and Customizing Reports
- Run Report – You can run the report now or you can schedule it to run later. So, for report scheduling, it is very important to know that people need updates on a daily, weekly, and/or monthly basis. Once you select a cadence option, you’ll need to enter the user, email report, and schedule it accordingly. NOTE: One thing to keep in mind is if you are emailing the report to others, make sure that the folder in the report is saved as public and not private.
- Hide Details / Show Details – Hides or shows the details according to the selection.
- Customize – That’s where you go back to edit and customize.
- Save – Saves the changes made.
- Save As – Saves the changes as a new report.
- Delete – Deletes the report.
- Printable View – Gives you a printable view of the report.
- Export Details – You can also export the details into a CSV or Excel format for better understanding.
- Add To Campaign – Where you can add additional members to the campaign. This will be specific to this campaign but may not appear in all reports.
- Subscribe – You can define a set of conditions to meet before sending a notification and choose how and when to be notified. For instance, if you wanted to set conditions around what conditions you want for this report to run, check them by creating this condition here and you can add additional rules. And then you can set a frequency, set direction, and then save and run.
Creating Report Folders, Bucket Fields, and Exporting Report Details
Creating Report Folders:
Creating a report folder is super easy. Follow the steps below and your report folder will be created:
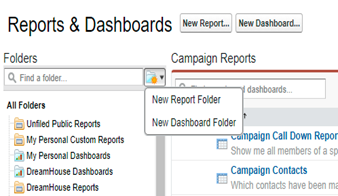
- Click on the “New Report Folder”
- Give it a unique name
- Click “save”
Bucket Field:
To learn more about the bucket field, we will be exploring “opportunity reports”:
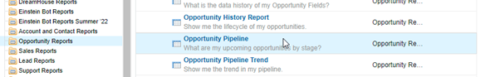
- Click on “Opportunity Reports”
- Click on “Opportunity Pipeline”
- Click on “Customize”
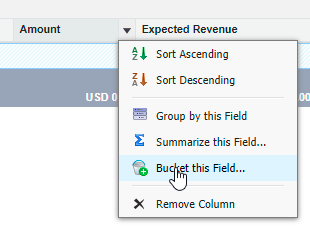
(As you can see, we have a column named “Amount” with a down arrow.)
- Click on the Arrow to get more options
- Click on “Bucket this Field”
You should now get a Popup with options to fill the Bucket Field Name and to define ranges as shown in the image below.
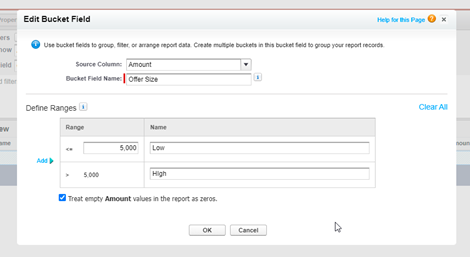
You can also Customize it by adding an additional column if you wish to. Refer to the image below.
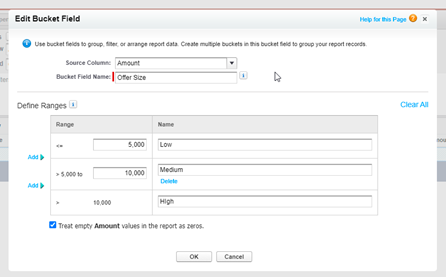
You should now see a new field named “Offer Size” with the names for respective ranges.
You can now also Group your records by offer size by just Dragging It into the report.
Exporting a Report:
After saving the report, you can now export the report by clicking on the “Export Details” option.
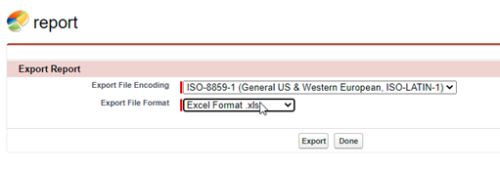
Here we have Two Options to export our data:
- Excel format
- CSV format
After selecting the desired format, click on “Export” and the report will be downloaded to your downloads folder. After downloading, you can click on “Done”.
Sharing Model Impact on Reports
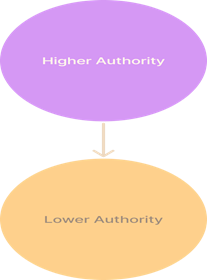
The Sharing Model and its Impact on reports plays a very important role. Let’s consider as a Higher Authority I have 5 opportunities, and the sharing setting on the opportunity object on my Org is Private.
A person named Jim Doe is at a Lower Authority, and he should Not Be Able to See these opportunities.
Log in with a lower authority and navigate to the opportunity pipeline and verify that Jim Doe is not able to access the opportunities. This is because the Sharing Setting and the sharing model on the opportunity model is set to Private.
Conclusion: As a higher authority, I can access the opportunity because I am high up in the hierarchy and Jim cannot because he is below me in the role hierarchy. Here, Jim Doe will only be able to see the opportunities that he owns, or his team owns. As a result, the Number of Reports available to two users May Differ.
Creating and Modifying Dashboards
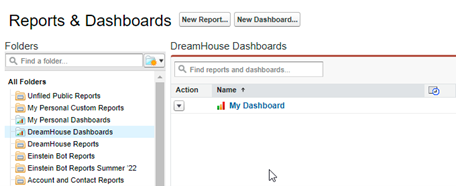
To create a new dashboard, click on “New Dashboard“. You will be redirected to the page where you can find your Dashboard Palette and can create a dashboard.
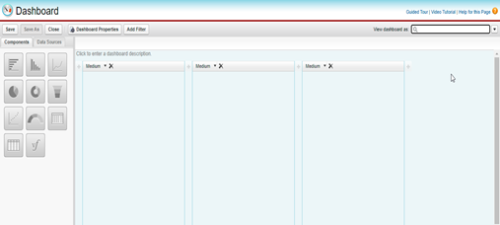
For now, you might have much on your dashboard page, but you can go through the App Exchange and install an app that provides details around Salesforce Adoption Dashboard.
Previously, the difficulty that users experience is that the dashboard only supports three columns, thus they Increased the Number of columns in Lightning Experience.
To pick any component in the dashboard, simply Drag and Drop the component onto the dashboard. To customize a component, you can change the header, title, data source, and footer. By clicking the button next to close, you can change the Component’s Settings.
By dragging and dropping, you can change the Data Source for Reports and VisualForce pages.
NOTE: You won’t be able to save the dashboard if any component has an error; instead, you’ll have to remove the component and save the dashboard again to make the modifications.
Custom Report Types
- Go to the “Reports” page
- Click on “New Report“
Consider a situation where you wanted a customized report that combines accounts, contacts, and sales. As you can see, there is no such option available, which involves more complex reporting requirements.
Let’s see how we Create a Custom Report Type.
Steps:
- Search for “Report Type”
- Click on “Report Types” and you’ll be redirected to the “custom report types” screen
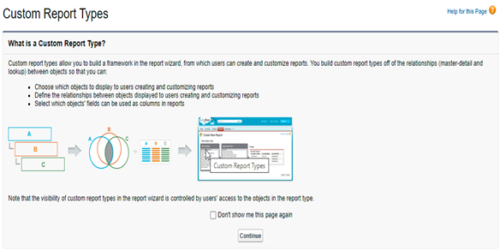
This is an Important Screen that gives you Details on the structure and organization of the custom reports.
Click on “Continue,” to navigate to the “New Custom Report Type”.
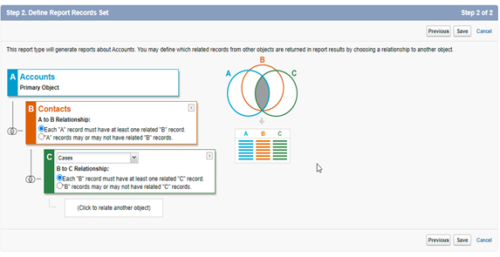
- From the dropdown menu, choose the Primary Object, which will determine what sort of records and rows will be the subject of reports generated by this report.
- Give the report type Label and Name, followed by a Description, and the category in which you want the report to appear.
- The final stage is to select the development stage i.e., “Deployed” or “In Development”
- Verify that the primary report type is set to “Account”.
- Click on “Click to relate another object” and select the secondary objects.
- Click on “Save” and we will have our new report type.
- Scroll down and you can see the Object Relationship Map and the Fields that are available.
- You can also Edit the layout to select or remove the desired fields.
Conclusion: We had an introduction to why reports and dashboards are important. We learned how to customize a report; how to create report folders, bucket fields, and export report details; how Sharing Model impacts reports; how to create and modify dashboards; and the different custom report types.
Very Informative Blog, Thanks for sharing.
Very informative, Good job! Thanks for sharing such a good blog.
It’s a great blog, thanks for sharing!
Very nice and Informative.
Nice Blog, very informative
Very Informative Blog Nikita, Thanks for sharing!