
Calculated table joins are used to couple two or more tables of data. Common examples include CROSSJOIN, UNION, EXCEPT and INTERSECT.
Common Use Cases for Calculated Table Joins in Power BI
- Blending or combining data across multiple tables.
- Creating advanced calculations like new vs. returning users or repeat purchase behavior.
- Querying tables to troubleshoot errors or understand connections in a data model.
CROSSJOIN
CROSSJOIN() Returns a table that contains the cartesian product of the specified tables.
It is a cartesian product of two sets, forming a new set containing all ordered pairs.
= CROSSJOIN(Table, Table, […] ])
Multiple table expressions can be included in a crossjoin.
Examples:
- ‘Dim Product’
- VALUES(‘Fact Sale’[Store ID])
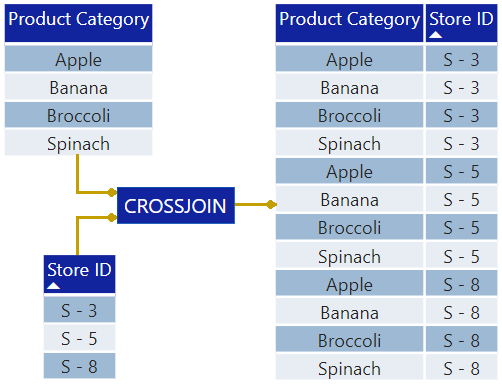
Resulting table contains 12 rows (4*3) and 2 columns (1+1)
Important Points
- Column names must all be different in all table arguments.
- The number of rows returned equals the product of rows in all tables.
- The number of columns returned equals the sum of columns in all tables.
UNION
UNION() Combines or “stacks” rows from two or more tables sharing the same column structure.
= UNION(Table, Table, […])
Accepts any DAX expression for two (or more) tables with identical column structure.
Examples:
- ‘Table 2021’, ‘Table 2022’
- ‘Table 2021’, DATATABLE()

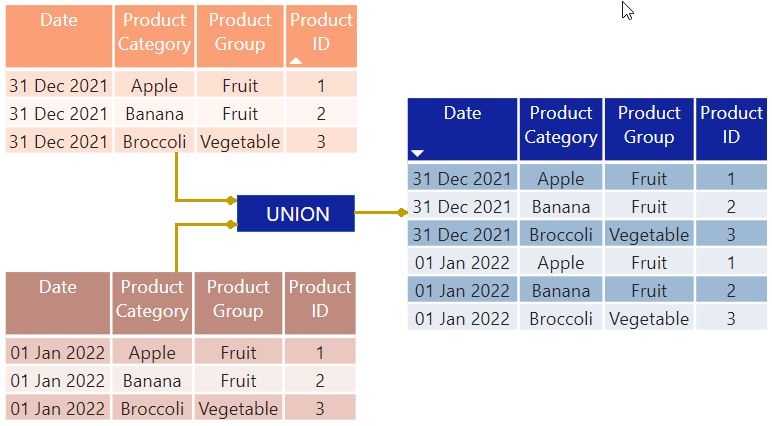
UNION stacks tables together, just like append
Important Points
- All tables must hold the same number of columns.
- Columns are grouped according to their position in their respective tables.
- Column names are determined by the first table expression.
- Duplicate rows are retained.
EXCEPT
EXCEPT() Returns all rows from the left table which do not appear in the right table.
= EXCEPT(LeftTable, RightTable)
The left and right tables used for join.
(NOTE: The First table must be a table inside the data model.)
Example:
- EXCEPT(‘Dim Product A’, ‘Dim Product B’)
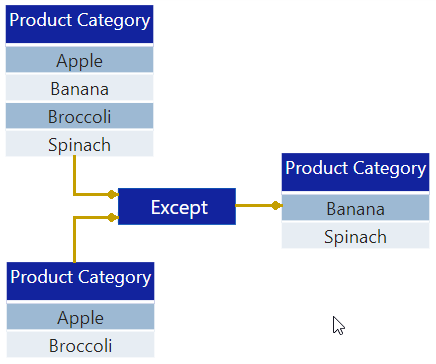
Resulting table contains rows which ONLY appear in the left table
Important Points
- Both tables must hold the same number of columns.
- Columns are compared based on positioning in their respective tables.
- Column names are determined by the left table.
- The resulting table does NOT retain relationships to other tables (can’t be used as an expanded table).
INTERSECT
INTERSECT() Returns all the rows from the left table which also appear in the right table.
= INTERSECT(LeftTable, RightTable)
The left and right tables used for joining.
(NOTE: The first table must be a table inside the data model.)
Example:
- Previous Month Active Customers =
LeftTable: VALUES(‘Fact Sales’[Customer ID]),
RightTable: CALCULATETABLE( VALUES(’Fact Sales’[Customer ID]), DATEADD(‘Dim Calendar’[Date],-1, MONTH))
- INTERSECT(‘Dim Product A’, ‘Dim Product B’)
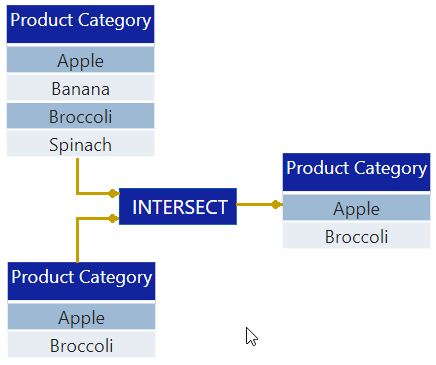
Resulting table contains rows which appear in BOTH tables
Important Points
- Order matters! The result of (T1, T2) may be different from (T2, T1).
- Columns are compared based on positioning in their respective tables.
- Duplicate rows are retained.
- Column names are determined by the left table.
- The resulting table does NOT retain relationships to other tables (can’t be used as an expanded table).