
The following are the steps that play a significant role while developing a Power BI report:
Step 1: Get Data (Identifying the Data Sources)
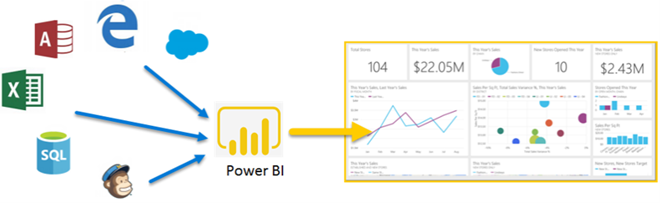
Power BI provides a direct way, i.e., the “Get Data” feature, through which you can connect to various sources that range from flat-file, server-based, and cloud-based data sources. The data can be connected through two modes Direct Query and Import Mode.
Direct Query
Direct query enables you to query the source in real-time; however, querying server-based data sources has the following limitations:
- Enterprise Gateway required.
- All tables must come from the same database.
- No data type changes.
- No calculated columns or tables in the model.
Import Mode
Import Data Connectivity mode lets you import data into the Power BI cache. Highly recommended to use an Import connection when the data size is less than 1 GB and the data is not continually changing. You can import data with a scheduled refresh to get the latest data. With Import connection, you can take full advantage of the high-performance query engine.
Step 2: Data Cleaning (ETL) Using Power Query
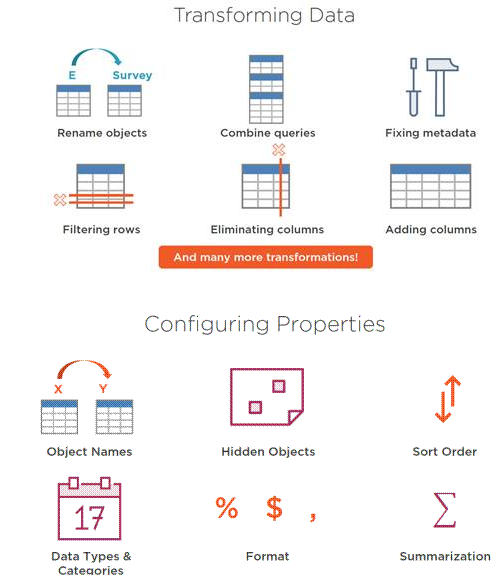
Data cleaning also plays a vital role in improving the performance of the reports. After importing the data, it should be cleaned before using it in the report, for those multiple transformations must be performed over the raw data. Power Query transformations can be done quickly, while Advanced Editor can be used for complex ones.

The Future of Big Data
With some guidance, you can craft a data platform that is right for your organization’s needs and gets the most return from your data capital.
Step 3: Data Modeling
Data modeling is the process of modeling data tables. In most real-world problems, you will get data stored in various related tables while dealing with relational databases. We can create a star schema and snowflake schema using the Power BI data model window. You can easily create a data model using the manage relationship icon in the Power BI modeling ribbon. When you click on that icon, the create relationships box appears where you can specify the type of relationship. Power BI provides the below cardinality options while building relationships.
- Many to one (*:1)
- One to one (1:1)
- One to many (1:*)
- Many too many (*:*)
Power BI is excellent at setting the cardinality to default; it puts it according to your data.
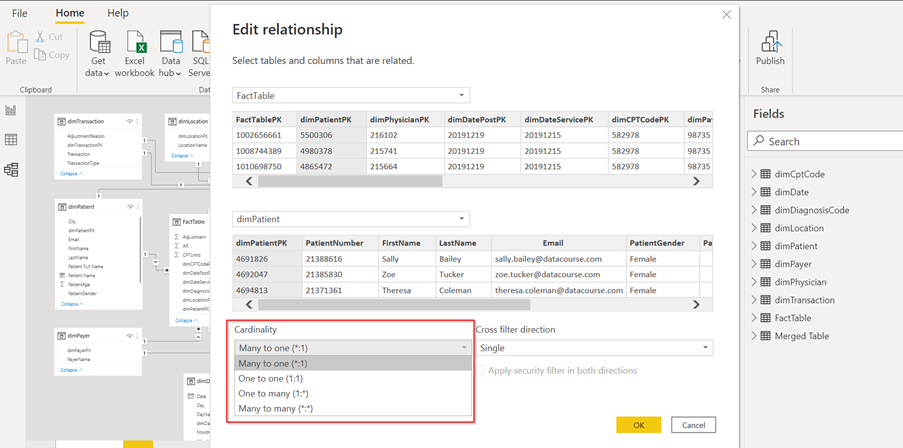
You also need to make sure that you edit the Cross Filter Direction depending on your data model. Power BI often chooses Single for the Cross Filter Direction, but in some cases, it will select both options.
Step 4: Data Visualization
Data visualization brings data to life, making you the master storyteller of the insights hidden within your numbers. Through live data dashboards, interactive reports, charts, graphs, and other visual representations, data visualization helps users develop powerful business insights quickly and effectively. Power BI lets you make a suitable dataset into
- Pie Charts
- Bar Charts
- Column Charts
- Line Charts
- Scatter Charts
- Bubble Charts
- Map
- KPI’s
- Table
The visualization pane in the figure below in Power BI desktop is used to select the dashboard chart and the data pane columns.
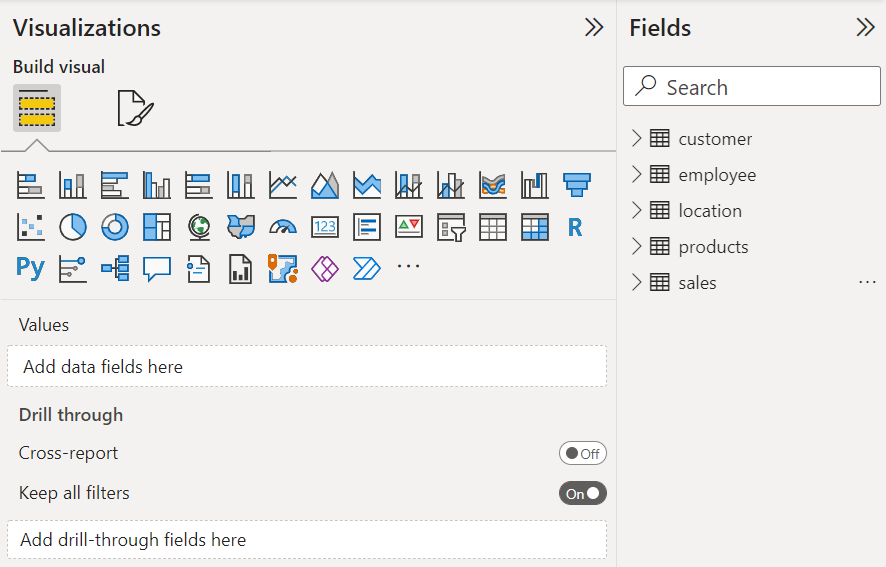
You can also use ‘Custom visuals’ from the Microsoft App source based on the requirement and advanced features like bookmarks and selection to create interactive reports. Once the report has been created, the final view will look like the below screenshot with charts, titles, and filters.

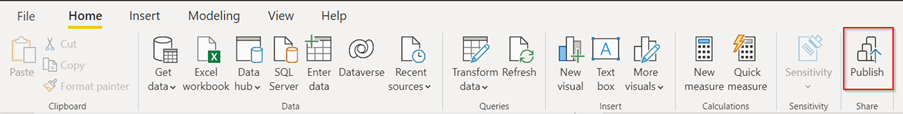
Step 5: Publish The Report
Once the report is ready and tested, need to follow the below steps:
- In Power BI Desktop, choose File > Publish > Publish to Power BI or select Publish on the Home ribbon.
- Sign in to Power BI if you aren’t already signed in.
- Choose the workspace into which you want to publish.
- Once publishing is complete, you will receive a link to your report through which you can view your report over the power bi service.
Very Informative & Nice Blog Harshal!!