
Let’s discuss Azure Application Insights and the simple optimization we can do to avoid surprise bills.
Azure Application Insights can be used to monitor and check our applications’ health, analyze logs and other metrics related to our application, and view other resources which are included in our Azure subscription. Many teams may have different objectives when using Application Insights with various features. Although we might not use all the features that are available with Application Insights, at a minimum, we use them for logging.
If you ask me, “Logging is an art.”
For application teams to understand issues in Production, how much logged information is needed? There is no single formula or concrete definition, but at a minimum, a log should be able to tell the operation, action, client details consuming the operation, and other request and response information with critical information masked. If we have this information, application teams should be able to replicate the issues in their test environments.
The logs often give an understanding of what would have happened when the execution failed. There is no point in logging exceptions with huge stack traces without supporting information on what happened before the exception.
In general, it is good to use different logging strategies based on the type of log.
- Are we logging to capture crucial states of transactions?
- Are we logging to capture transient errors like connectivity issues and authentication issues?
- Are we logging information to capture application workflow steps?

Logging is often overlooked when we perform application migrations to Cloud. The next time when we are trying to perform an application migration, it is good to think about the Logging strategy that is in place.
For example, consider the following scenario. Let us say we have a job that processes information when records appear in the database. In general, the job would be polling the database for every 5 minutes to look for data that satisfies a specific condition. When new records are present, the job would go ahead and pull the new data and start processing. In this process, the job would emit information logs which are stored in the filesystem as text files or stored in the database. When all the process is completed, the job would update the status of the records in the database so that these records are not considered in the next iteration. If all goes well, this approach works well.
Now when we shift this application to Cloud and start using Azure Application Insights, these logs would be captured in the Application Insights. Now consider a scenario where the jobs fail to process the data. For example, let us assume there was bad data. The job in every run would be failing and unable to update the status of the records to complete. In every run, the job will be trying to process the bad data. The job would be continuously emitting logs with the error message for every run.
We know that the job polls for new data every 5 minutes. These errors eventually land up in our Application Insights. So let us say there are around 10 records with bad data, and every 5 minutes, the job would be emitting logs with errors and other information logs in our Application Insights which are captured using the AppInsights SDK telemetry option.
As per Azure Monitor Pricing, “Log Analytics and Application Insights charge for data they ingest.”
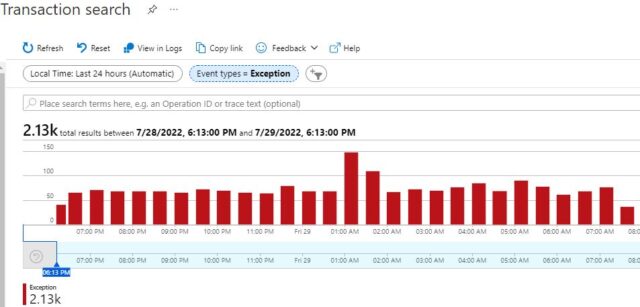
Eventually, our Application Insights will be ingesting lots of exception messages, and there will be a lot of noise. If unnoticed, these logs fill the Application Insights, and we would end up paying for the noise.
So how do we avoid situations like these?
To avoid situations like these, it is always good to implement a Circuit Breaker Pattern along with a retry option. Let us say we set the threshold for the retry pattern as 3. When our jobs try to process records, and if they fail continuously 3 times, the job will mark the records as failed in the subsequent runs. This way, we can avoid sending data to our Application Insights, and we could save amounts that would reflect huge savings eventually.
We will not see the impact immediately by performing small optimizations like these, but overall, we will realize the benefits.
What are a few optimizations you have tried to save costs with your applications in Azure? Feel free to comment.