A guide towards an entry to Google Analytics with Naeem Sheikh.
What is Google Analytics?
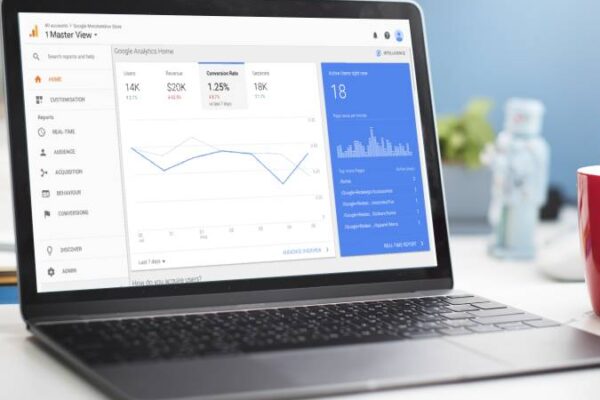
Google Analytics is a web analytics service offered by Google that will help in tracking website traffic and generate an easy understandable report to analyze the performance of your website. It is basically divided into five major report i.e. Realtime report Audience report, Acquisition report, Behavior report and Conversion report. Google Analytics tool is free of cost for everyone. You just must create account with website details and add a tracking code generated from Google Analytics to head section of each webpage you want to track.
Why Google Analytics?
Benefits of Google Analytics
- If you are an entrepreneur, business owner or marketer then Google Analytics is likely the most valuable tool you can figure out how to utilize.
- Successful organizations are not based on mystery. They flourish with your ability to settle on data-directed decision.
- Google Analytics provide you the metrics to see what’s working and what’s not.
- Google Analytics will help you in tracking your website’s online traffic and helps you in understanding the user behavior.
- Organizations generally use the data collected by Google Analytics to improve the website traffic and find the target audiences.
How Google Analytics Works?
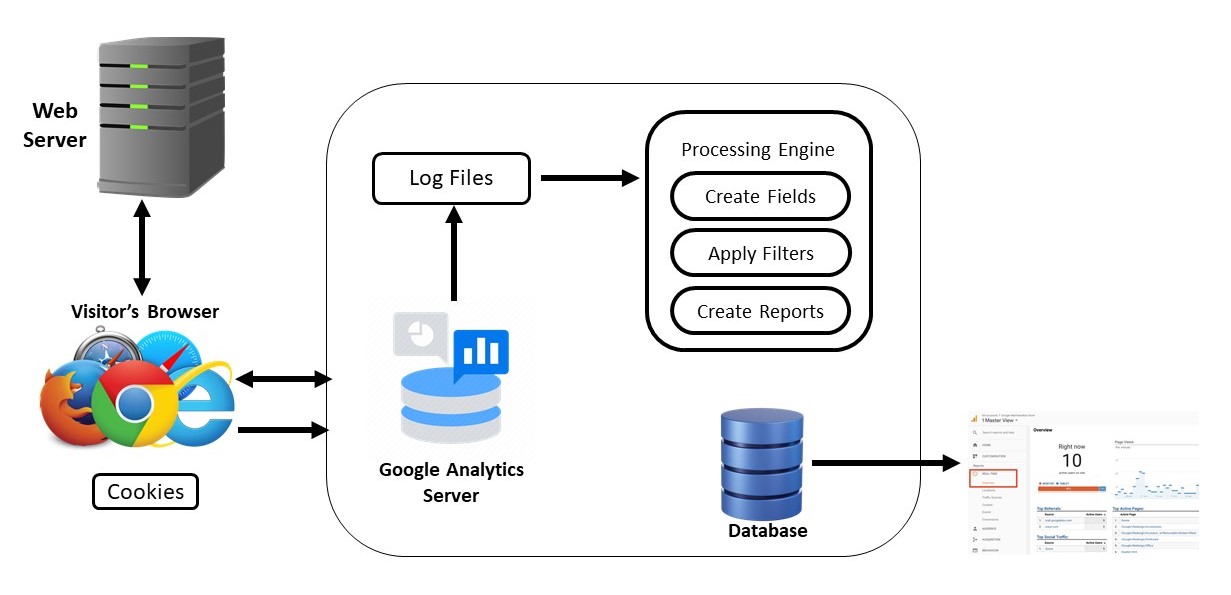
- The process of data collection begins with a visitor’s request to open a page from the web server. The server sends the requested webpage back to the visitor’s browser.
- The browser of that visitor requests the code from a Google Analytics server, and the server responds by sending that code to the visitor’s browser.
- After all the appropriate data has been collected, the Google Analytics Tracking Code sets a few cookies.
- After fetching the cookies, the tracking code sends data back to Google Analytics server.
- When the Google Analytics server receives this request, it stores the data in a logfile which is a large text file. There is one line in the logfile for each pageview created by Google Analytics.
- At some regular interval, usually every few hours, Google Analytics processes the data in the logfile.
- After each line of logfile has been broken into fields, filters are applied to the data.
- Finally, after the filters have been applied, the reports are created and stored in the database. Each report in Google Analytics is created by comparing a field, like the Visitor City, to a piece of integer data (Visits, Pageviews, Avg. Time on Page, Bounce Rate, Conversion Rate, Exit%, etc.).
How to Set Up Google Analytics?
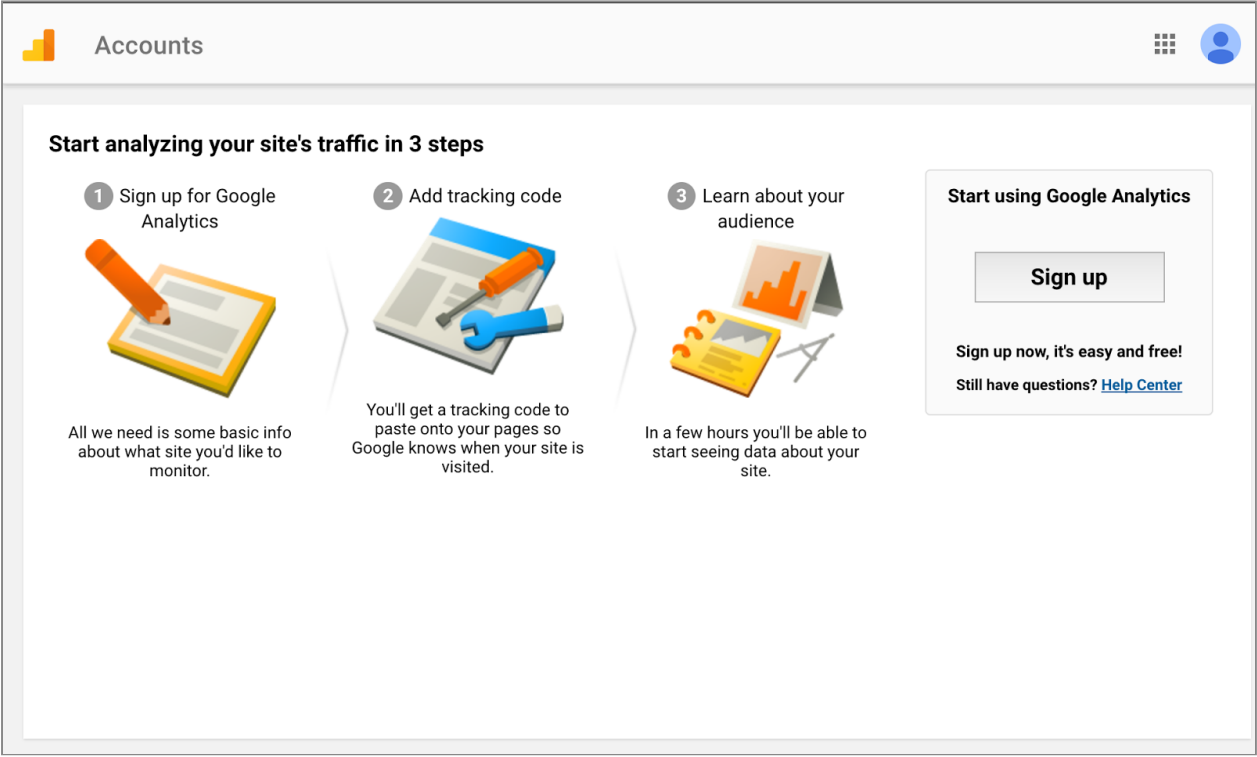
Step 1: Create or sign into your Analytics account. Go to https://analytics.google.com
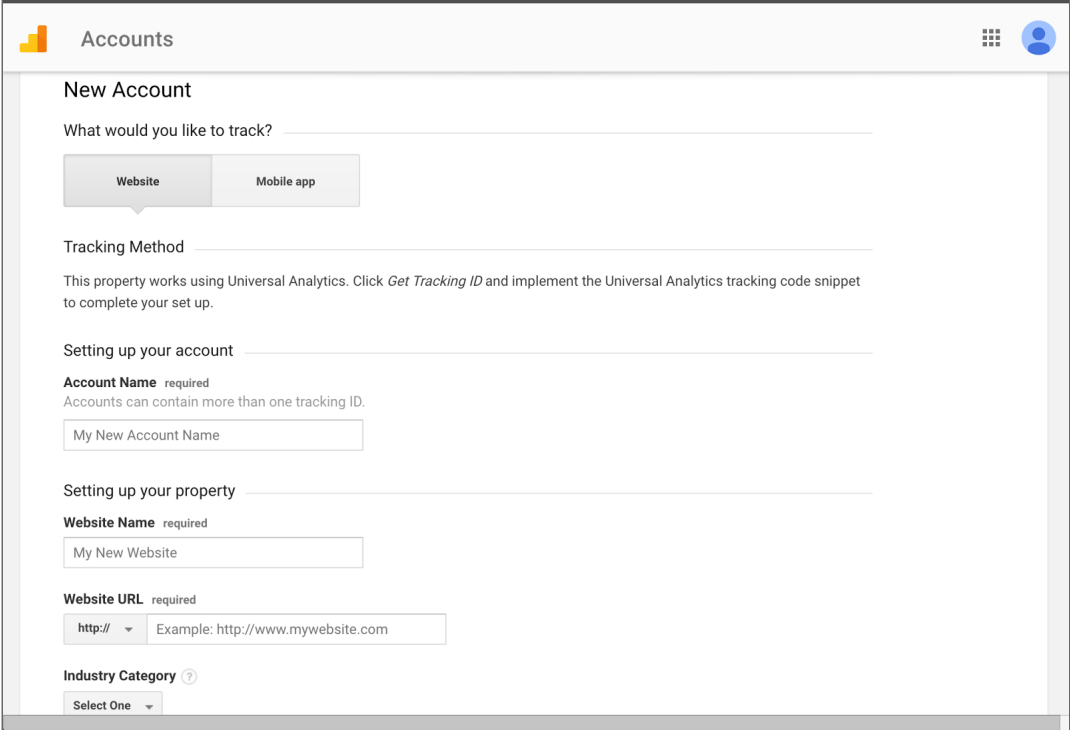
Step 2: Set up a property
Step 3: Add the tracking code to every webpage you wanted to track. Get the tracking code from Admin>Tracking Info and add it right after the opening tag on each page.
![]()
Step 4: Verify that the tracking code is working. Open your website in a separate tab and then check to see that your visit is being registered in the Real-Time reports.
![]()
How to Navigate Google Analytics?
Understand Google Analytics layout and navigation so you can quickly find the reports, tools, and features you need.
- Account/Property Switcher: You can easily switch between them if you have multiple accounts, properties.
- Search: Access key reports quickly without needing to click through the left-hand navigation.
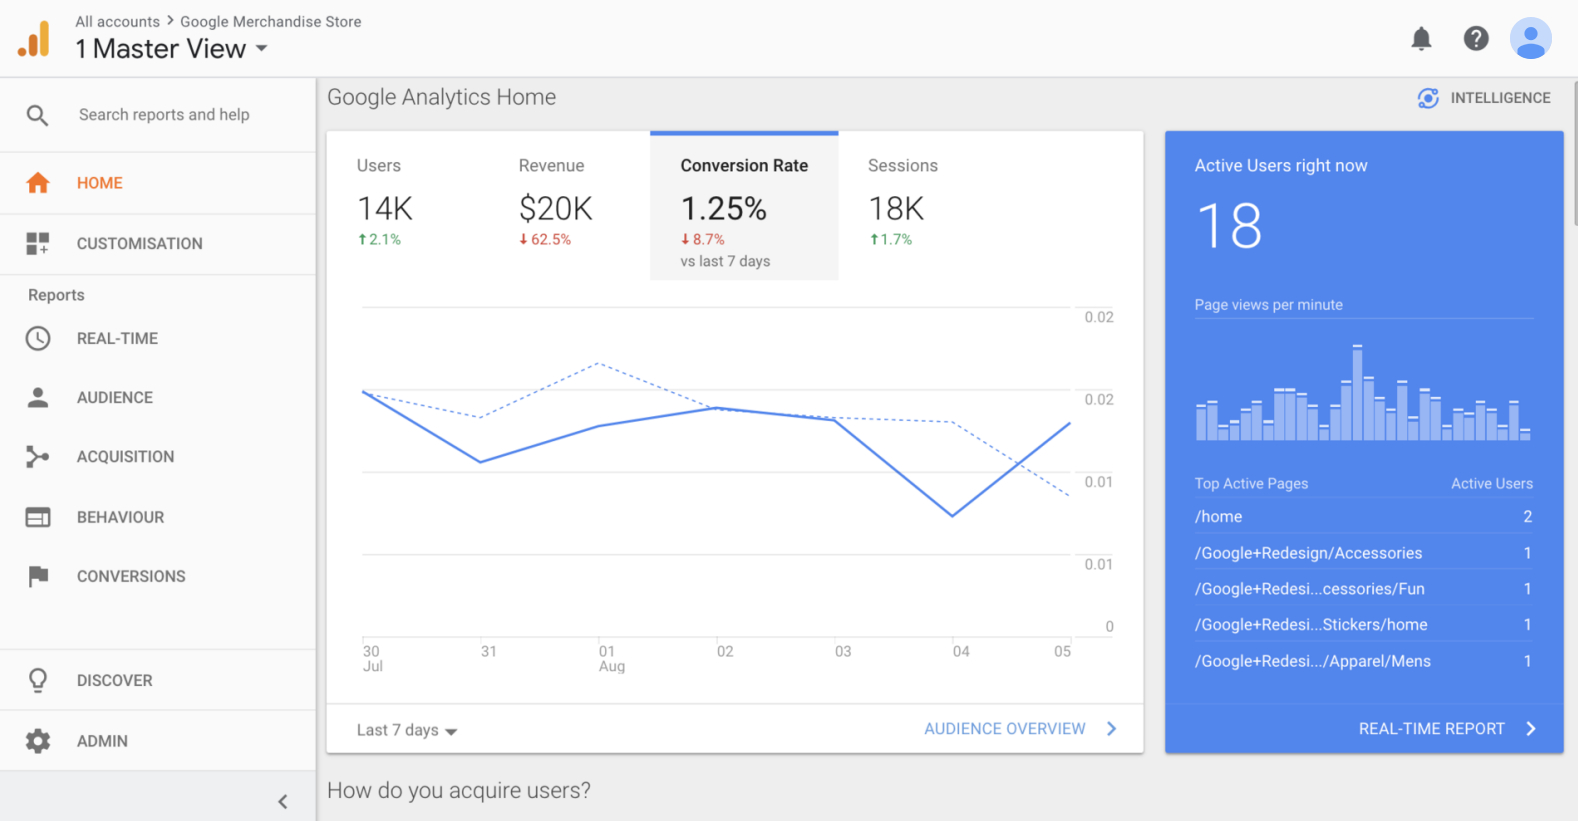
- Home Page: A summary of your site’s vital signs. Use it a quick check to see if everything is behaving as expected or the starting point for deeper analysis.
- Customization: The Customization section helps you in creating custom reports with metrics, segments, and dimensions, specific to your business.
- Left-Side Navigation: To navigate between specific reports, use the navigation on the left. By clicking on each of these sections you will explore the reports.
- Admin: Contains all your Google Analytics settings such as user permissions, tracking code, view settings, and filters.
How to Setup Goals in Google Analytics?
Goals measure how well your site or app fulfills your target objectives.
Benefits of Setting Up Goals
- Measure how frequently clients complete an action, called a conversion, that adds to the outcome of your business not simply the number of pageviews and visitors.
- See data in your goal reports regarding how your site perform against the goal you defined and any other report that provide data on goal Conversions.
- Identify the traffic source that delivers the most conversions not just visitors.
- Track the exact pathways users take before completing a Goal (landing page → page 2 → page 3 → conversion).
- Track the number of completions from individual marketing campaigns.
Steps to Set Up Goals
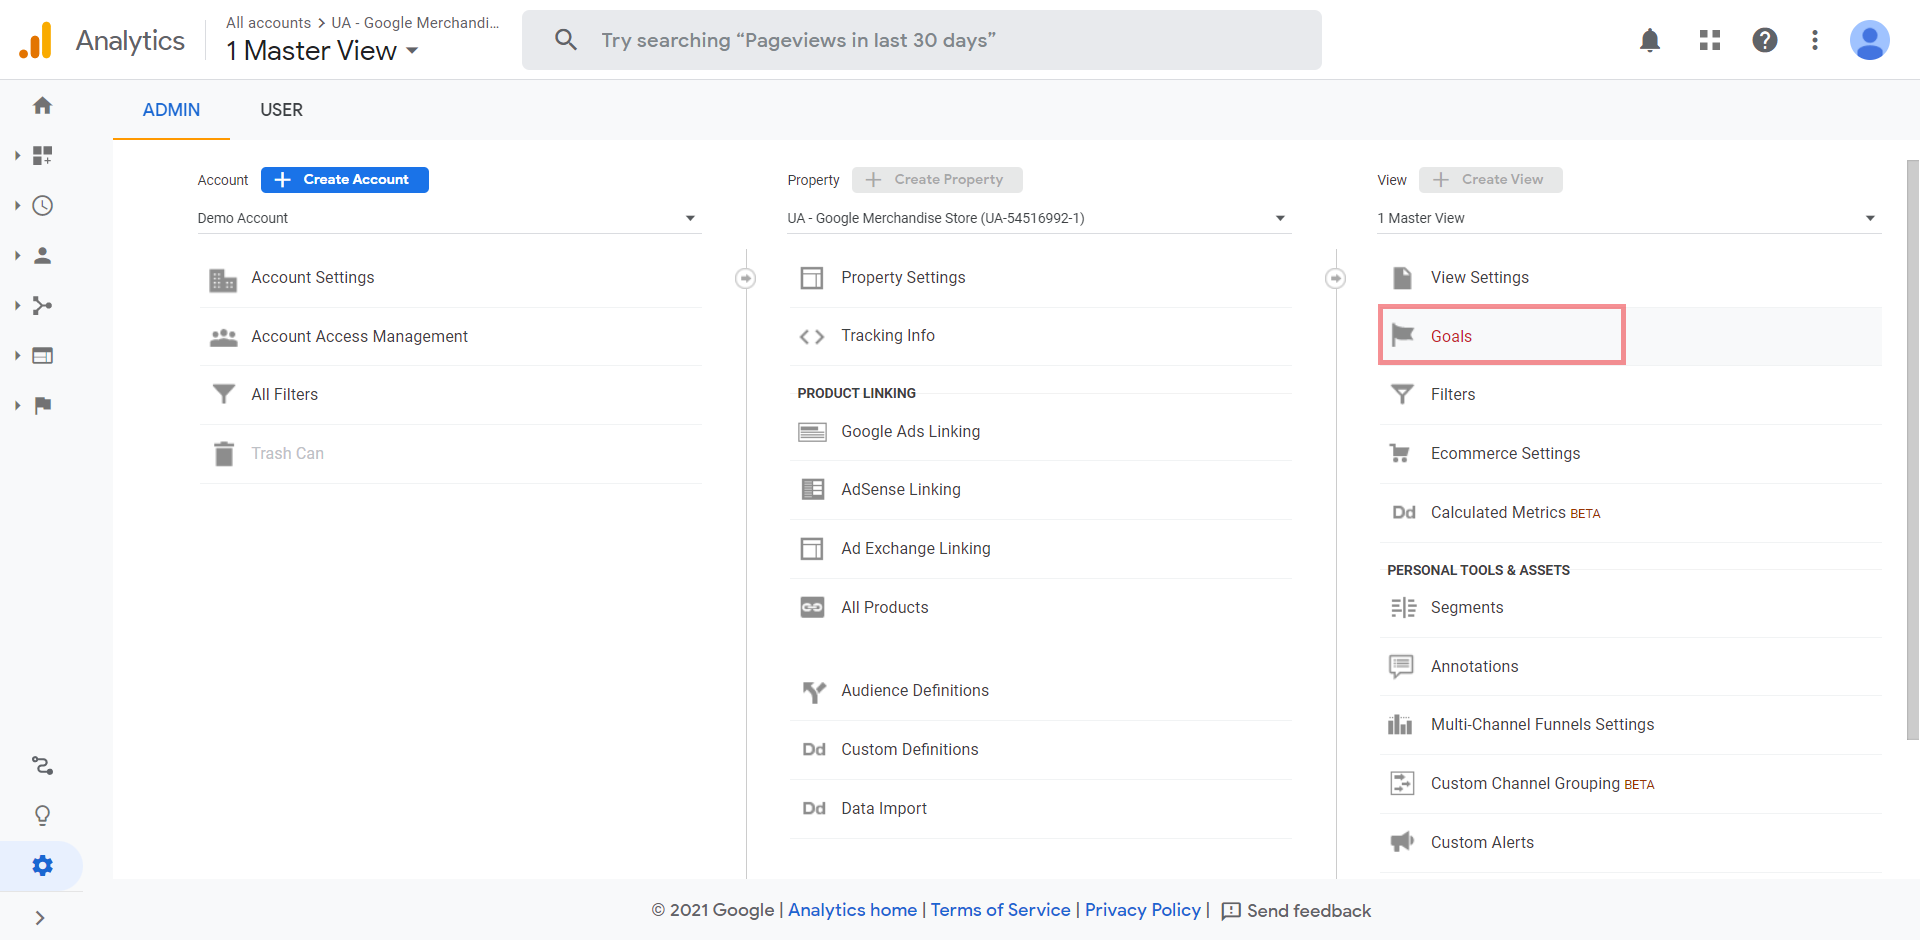
Step 1: Add a New Goal. Go into Admin >Views > Goals> New Goal. Note you will need edit access to create goals.
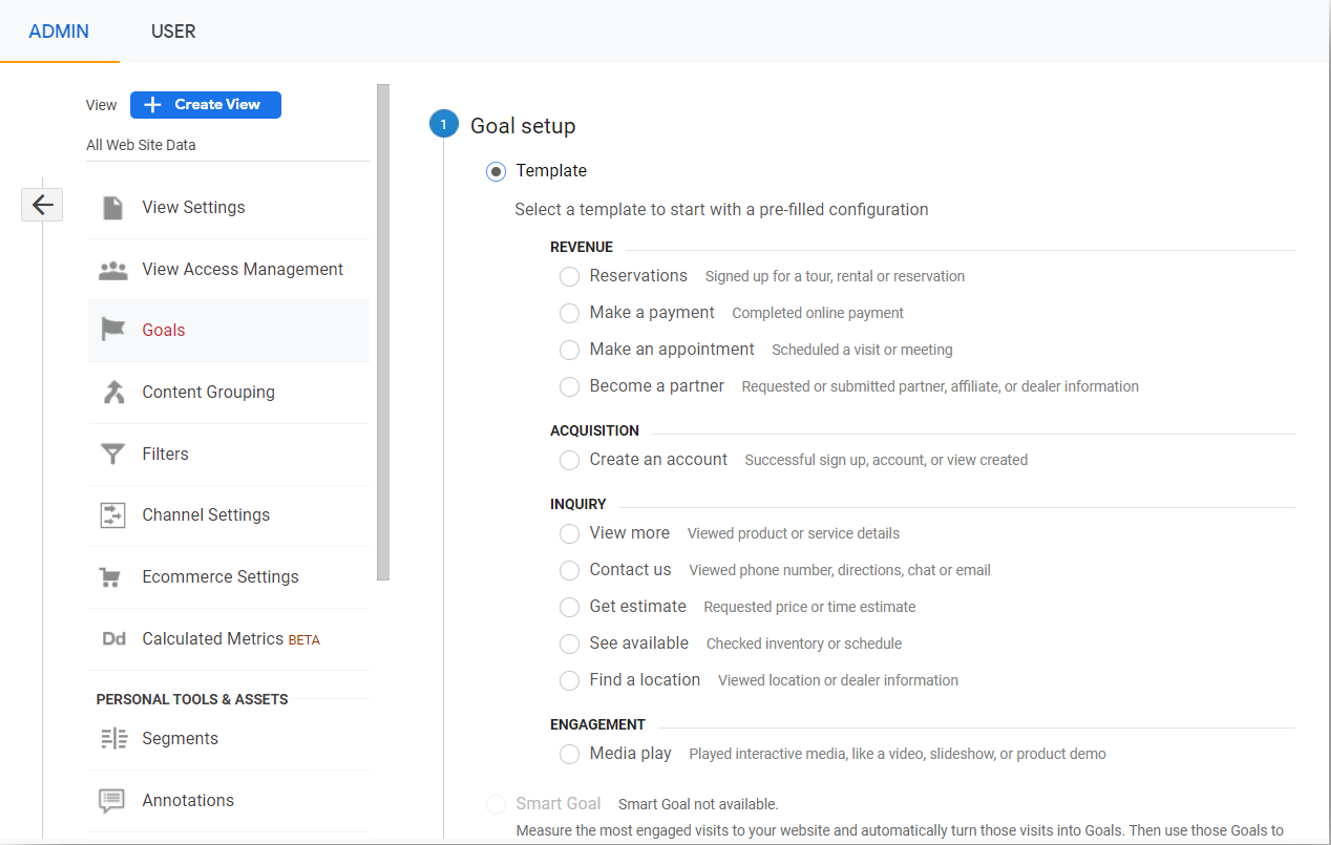
Step 2: In the Goal Setup option, you can select the template with pre-filled configurations, or you can select Custom Goal as well.
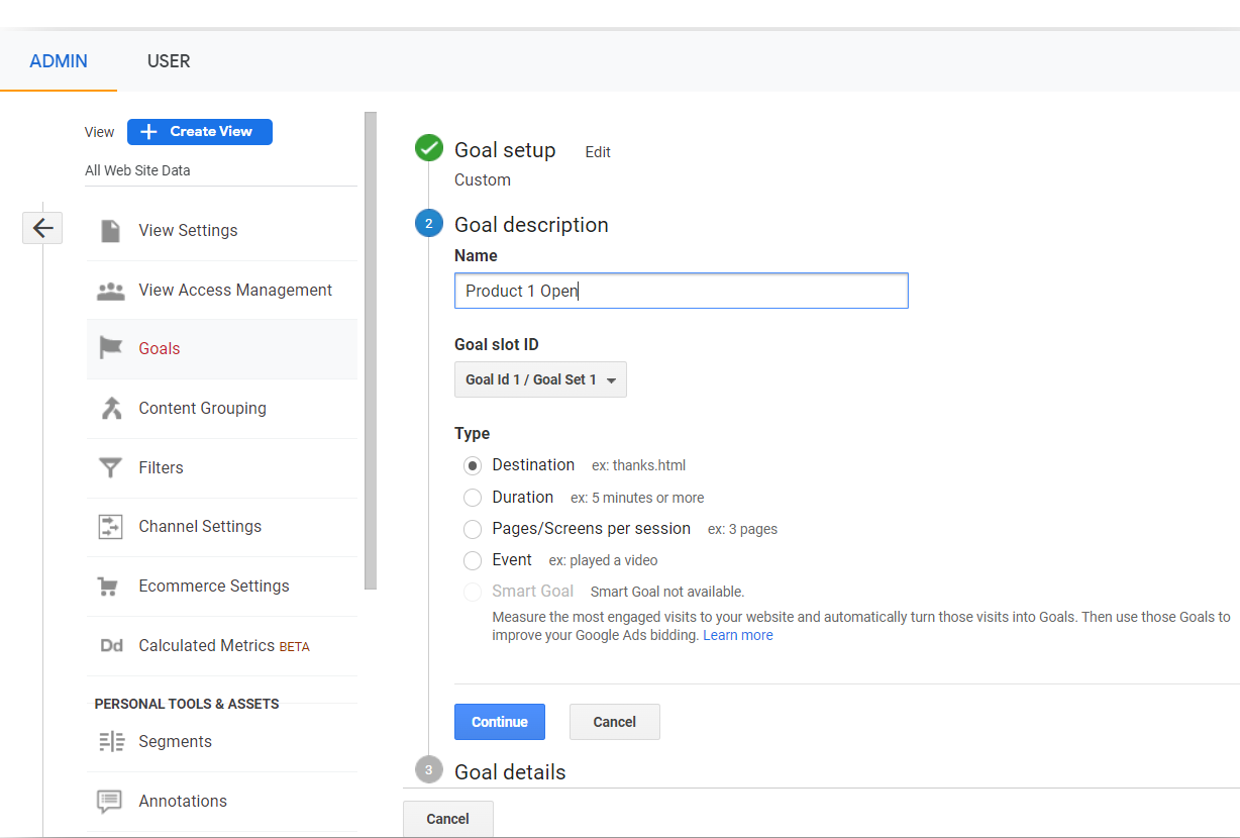
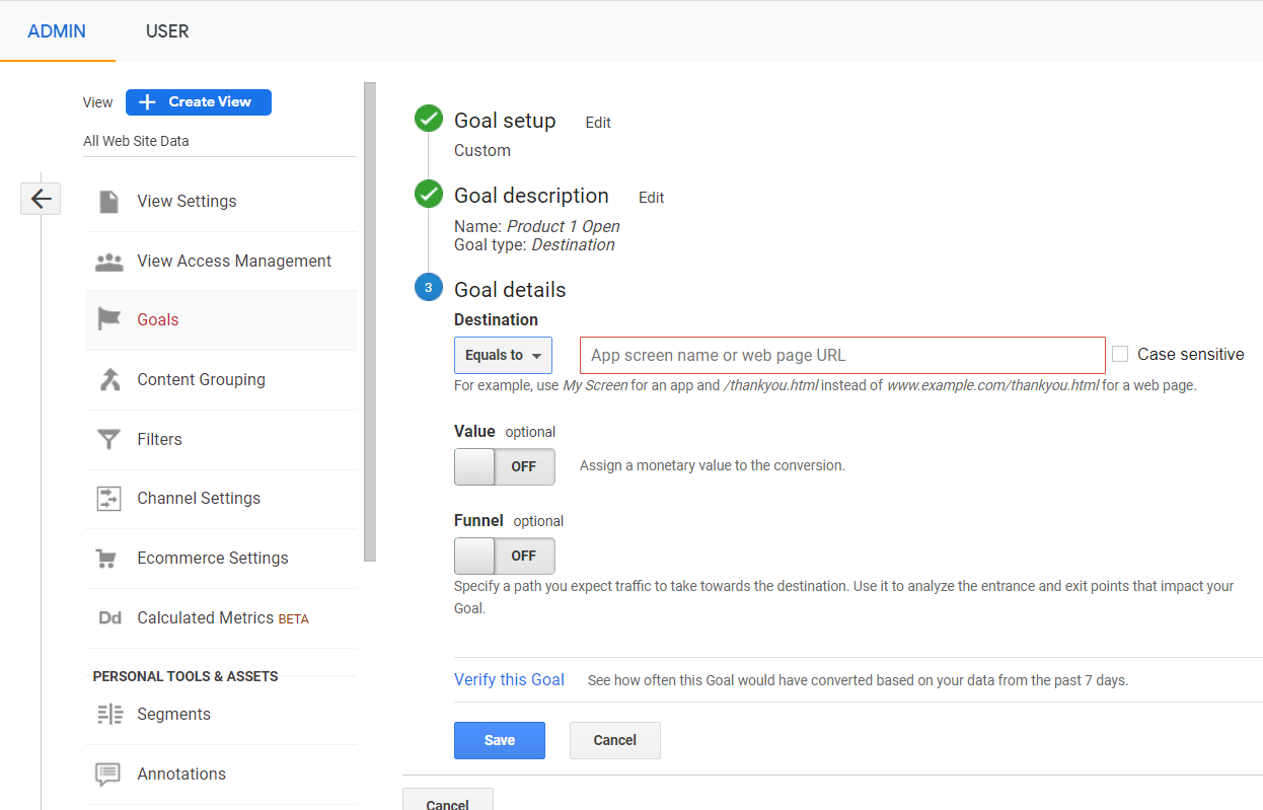
Step 3: Enter the goal name and chose the goal type. For example, landing page destination or any event.
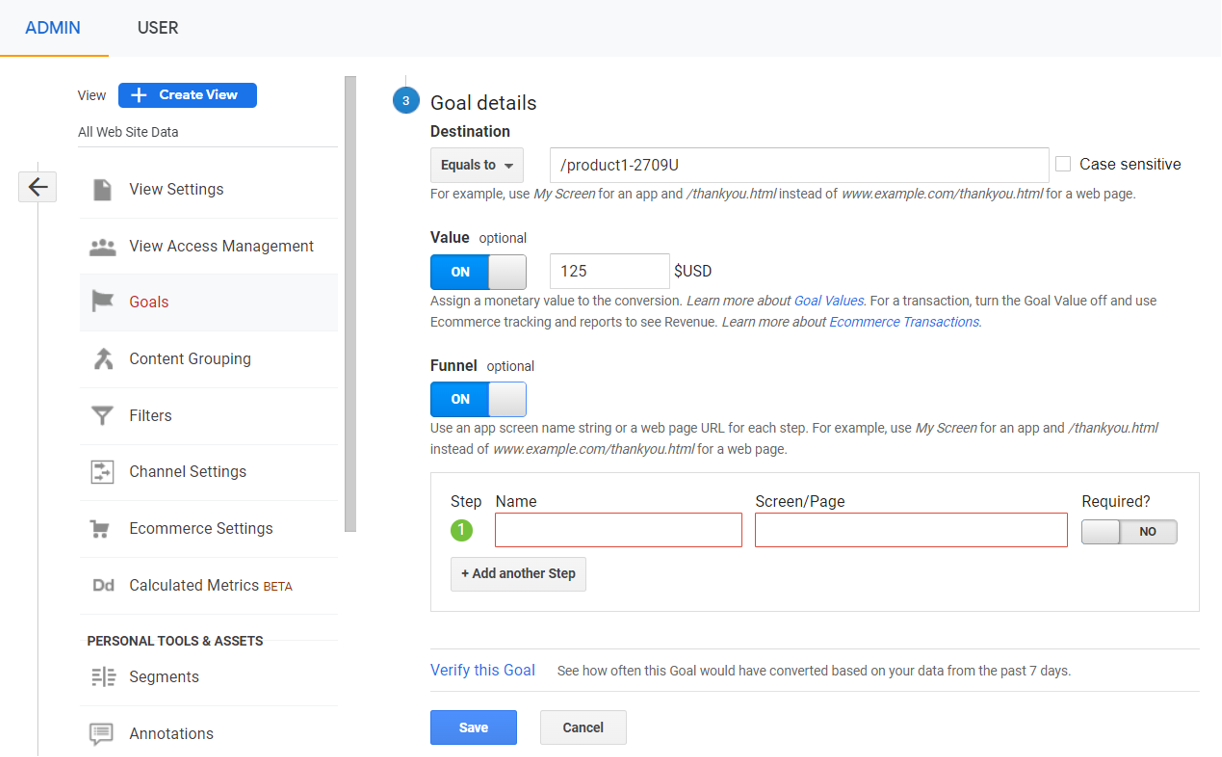
Step 4: Enter the Goal Details. Enter the URL of the page that is shown when the user converts or completes the conversion process. Click on the “Verify” at the bottom to check of its working or not.
Step 5: If the product is worth 125 dollar to your business, you could set a goal value equal to “125.” If we wanted to track actual revenue made from purchases, we would need to turn on ecommerce tracking.
Step 6: Add a funnel. Measure drops off at each step of the goal completion process (best suited to ecommerce).
How to Set Up Ecommerce Tracking in Google Analytics?
To measure the sales report like transaction, revenue, etc., go to admin>ecommerce settings >enable ecommerce and implement additional ecommerce tracking.
![]()
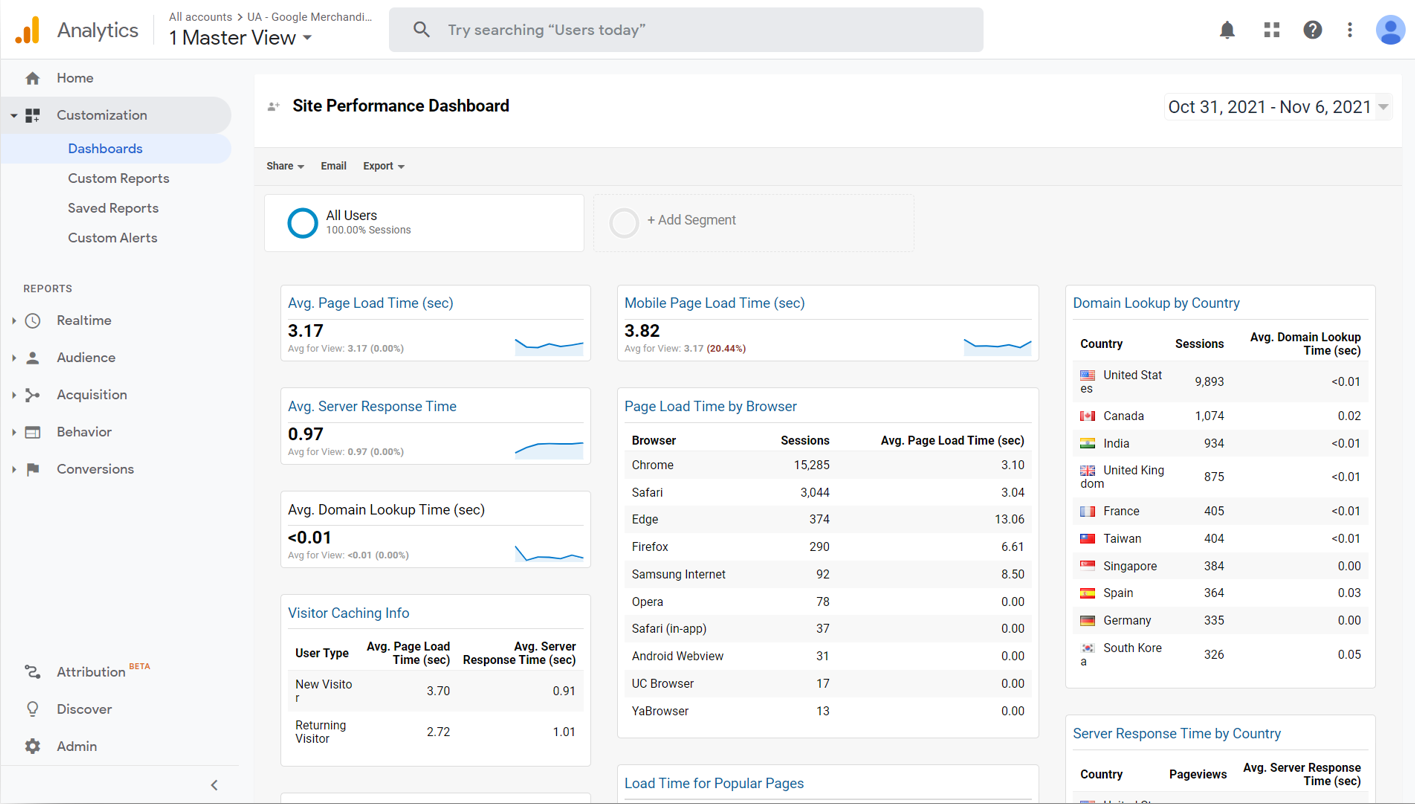
How to Set Up Google Analytics Dashboards?
Dashboards are an easy way to see an overview of the reports and metrics you care about most.
Benefits of Dashboard
- Monitor many metrics and dimensions at once, so you can quickly customize and check the traffic report of your properties.
- You can check correlations between different traffic reports.
- Create dashboards for different roles or metrics. e.g., site performance, eCommerce, PPC etc.
- Dashboards are easy to create, customize and share specifically to any person.
How to Analyze Key Reports in Google Analytics?
Audience Report
- Demographics: It shows the Age and Gender report of the website’s traffic.
- Interests: Interest information gives you a brief idea about expanding your advertisement into related users.
- Geo: Geo information consist of Location and language, and it can help in targeting the right customer in right location through advertisement.
- Behavior: It measures the behavior of users how likely they are visiting the website. It compared the ratio of New and Returning Users so that you can make changes according to that.
- Technology: Understanding the technologies through which users reaches to your website and some of them consume your product and services.
- Mobile: To check from which device the user is interacting with your website.
- Benchmarking: Benchmarking permits you to compare your information and accumulated industry information from other websites who share their information.
Acquisition Report
- Channels: See how well each channel drives traffic and conversions.
- Organic Search: Visitors who came to your website by searching on any search engines.
- Paid Search: Visitors who reach to your website from any search ad or display ad
- Direct: Visitors who visit your website with a link not containing any referral source.
- Referral: Visitors who reach your website from another website by clicking on a link.
- Social: Visitors who visit your website from a social network.
- Source/Medium: Identify the key partners and link source combinations that deliver the most traffic or revenue.
- Source: Source is the origin of the traffic, either a search engine or a link.
- Medium: Medium is the general category of the source from where the traffic was originated.
- Referrers: Visitors who reach your website from another website (but not Social Networks) by clicking on a link.
- Search Console: Provide information of your website performance on Google like queries, impressions of your website on search engine and how many click you got from there.
- Social: Traffic from any social network that are not tagged as an ad. It includes the social network, conversion, and landing page information.
Behavior Report
- Site Content: Site content consist of All pages, landing pages and exit pages report which let you know the amount of traffic your top pages are receiving through all the channels and the revenue each page is generating towards your business.
- Site Speed: This report will show you how your web pages are performing in terms of loading time. You will easily get to know which all pages you have to optimize for better performance.
- Site Search: Site search is another feature that will help you in understanding what users are searching in your website’s search box. You must enable this feature from the admin option of your Google Analytics account.
- Events: Events section in the Google Analytics will allow you to track specific interaction on your webpages such as link click, download specific file, scroll depth, form filling, etc. You need to setup your event tracking code, or you can add specific event tracking through Google Tag Manager.
- AdSense: Many website owners use Google AdSense to generate revenue from visitors who click on ads published by Google AdWords advertisers. This report will display the revenue you have generated with other metrics like CTR, revenue per thousand impressions and %age of revenue from pages.
Great in-depth guide. Thanks for sharing