
Image Role in Tableau:
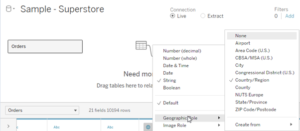
The first rule that we are going to discuss is the geographic role. If your data field contains location information or Geographical areas, you can assign it to a geographical role in tableau. Based on the type of location such as City, Country, State, or Postal Code. Assigning this extra role can help Tableau to plot your data correctly if you are showing Data in map visualization in Tableau there are multiple geographic roles as mentioned below but the most important are country Region City and Zip codes.
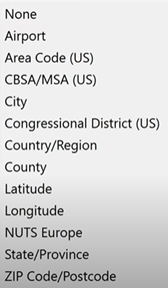
Tableau allows you to change the geographic role according to your needs. Once you’re familiar with the data
Now let’s talk about the other one which is the Image Role this is a brand-new feature in Tableau.
Just introduced that in 2022. So, you can imprint the image URLs pointing to images. Then you can assign this field to the image role with the URL to show the images in your desired graphs.
But there are some prerequisites.
1. Supported Image extension .png, .jpeg or .jpg
2. URL must begin with .http or .https
3. Image size must be less than 128KB
Now let’s take an example of how it can be represented in Tableau:
After creating the dataset you can set your column as Image role as in the mentioned image below. The icon will change to an Image icon which will help you to understand that this field belongs to IMAGE ROLE.
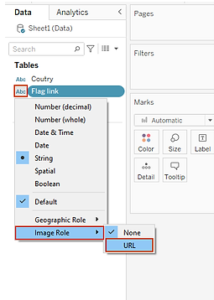
You can see the Flag Link under the Image Role URL option. You can directly put links in a subset of data and join with the primary data and you are able to put logos or images in visualization.
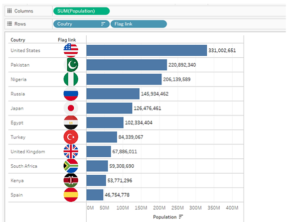
If you are building a dashboard about their products, categories, regions, and countries it’s really nice to show the relevant image for particular dimensions. You can use different Avatars also to increase the visibility of the dashboard Also, it improves the user experience and decreases the time to insight its catchier to have an image inside the visualizations.