The Key To Insights-Driven Decisions Is Curiosity Velocity
Organizations are awash in data; they are being flooded with new data sources, a proliferation of platforms, and spotty or missing governance capabilities. In this environment, users are challenged to effectively analyze data, generate insights, and use data to make insights-driven decisions.
Poor Data Culture Creates Less Productive, Overwhelmed, And Frustrated Employees
Accessibility, availability, and/or readiness of data for use remain the top three challenges in executing an organization’s vision for data and analytics. Sixty-one percent of organizations still use four or more business intelligence platforms, which means that analysts and insights professionals are constantly task- and context-switching, losing as much as 40% of their productivity. Data and analytics professionals report that they feel 11% less productive, 8% more overwhelmed, and 5% more frustrated at work when compared to a general global sample across professions.
Reasonably, organizations have chosen the path of least resistance and doubled down on technology investments. Technology can’t solve what is fundamentally a problem of human behavior and mindset, however. Instead, it is essential for enterprises to change their data culture to one that drives a purposeful focus not just on data and technology but that also considers human skills, emotions, behaviors, and resilience.
Enter Curiosity Velocity: The Key To Enabling Insights-Driven Decisions
In this report, we introduce the notion of “curiosity velocity,” defined as the speed at which a user can move from knowledge seeker to insights acquisition to action. Adding curiosity velocity to your KPIs supports leadership objectives of making decisions based on insights and breaking down organizational silos. It also forces business and IT partners to think carefully, not just about the time to produce and deliver clean, consistent data but also the time it takes to generate insights from the data and apply those insights in decision-making.
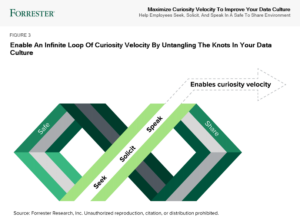
Leaders in technology, digital, and data fields can view this report and ask themselves five uncomfortable questions to identify and untangle the curiosity velocity knots within their data culture.
Now What?
Read the full report, Maximize Curiosity Velocity To Improve Your Data Culture. Connect with me through an inquiry to discuss your data culture, how to get leadership buy-in around curiosity velocity, and learn how this all connects to broader themes of data literacy, internal content strategy, and data communication.